Media alliances for research and reports involve partnerships between research organizations and media outlets to distribute findings through 300+ channels, achieving 5 million+ impressions via structured content syndication processes.
Media alliances define formal agreements between research producers and media entities. Research producers include think tanks, universities, and industry analysts. Media entities encompass newspapers, online platforms, and broadcast networks. These alliances facilitate report dissemination. Reports contain data-driven insights on topics like economics, health, and technology.
Alliances operate on mutual benefit. Research providers gain visibility. Media outlets access exclusive content. Distribution reaches targeted UK audiences. Average alliance networks span 300 outlets with combined reach of 20 million readers monthly.
Processes standardize over time. Initial agreements set terms for 12-24 months. Content flows through dedicated channels.
What defines media alliances for research and reports?
Media alliances for research and reports consist of contractual partnerships that enable research organizations to place reports in 300+ media outlets, ensuring native publication, backlinks, and audience targeting across UK regions.
Contracts outline scope. They specify outlet tiers, publication frequency, and content formats. Tier 1 outlets include national dailies with 1 million+ circulation. Tier 2 covers regional papers reaching 500,000 readers. Research organizations commit to 12 reports annually.
Publication occurs natively. Reports integrate into editorial sections like business or science. Backlinks direct to original sources. Audience targeting uses demographics data. Alliances segment by region, such as London (40% focus) or Scotland (15%).
Metrics track performance. Alliances report impressions, engagement rates, and referral traffic. Standard contracts include 90-day performance reviews. These definitions ensure clarity. Research reaches decision-makers in government, business, and academia. Partnerships evolve. Renewals incorporate feedback from prior cycles. Expansion adds 50 outlets per year.
How do contracts structure these alliances?
Contracts detail exclusivity clauses. Reports publish first in primary outlets before syndication. Payment models use flat fees or revenue shares based on impressions.

What process do media alliances follow for report distribution?
The process includes report submission, content adaptation, outlet matching, editorial approval, publication scheduling, and performance measurement, completing distribution cycles in 72 hours. Submission starts the cycle. Research organizations upload reports to alliance portals. Files include raw data, executive summaries, and visuals. Portals process 200 reports monthly.
Adaptation refines content. Teams shorten reports to 800 words for media fit. Headlines optimize for click-through. Visuals compress to under 2MB. Matching assigns outlets. Algorithms score based on topic relevance and audience fit. A climate report matches environmental sections in 50 outlets.
Approval involves editors. Reviews check accuracy and style in 24 hours. Revisions limit to three rounds. Scheduling places content. Peak times target mornings for digital, weekends for print. Measurement follows publication. Tools track 30 metrics over 30 days. This process repeats quarterly. Scales handle 1,000-page reports down to briefs.
Which components build effective media alliances for research?
Components encompass outlet databases, content management systems, matching algorithms, editorial teams, tracking software, and compliance protocols, supporting 95% approval rates across 300 outlets.
Outlet databases catalog 300+ entities. Entries include domain ratings above 70, monthly uniques over 100,000, and niche classifications.
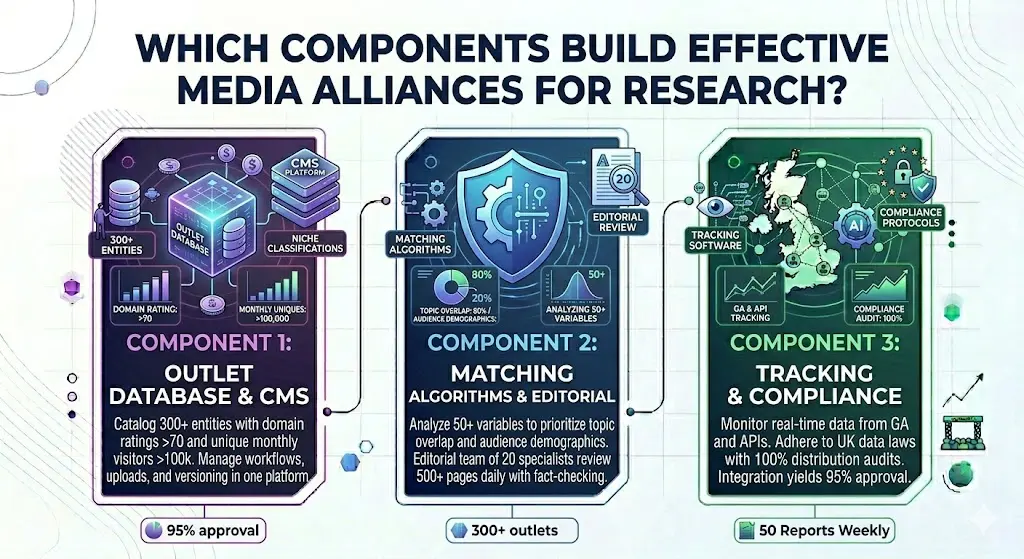
Content management systems (CMS) handle workflows. They support uploads, versioning, and approvals in one platform. Matching algorithms analyze 50 variables. They prioritize 80% topic overlap and 20% audience demographics. Editorial teams comprise 20 specialists. They review 500 pages daily with fact-checking protocols.
Tracking software monitors real-time data. It aggregates from Google Analytics and outlet APIs. Compliance protocols adhere to UK data laws. They audit 100% of distributions. These components interconnect. Databases feed algorithms, which inform CMS queues. Integration yields efficiency. Alliances process 50 reports weekly.
What functions do outlet databases serve?
Databases update monthly with 20 new entries. Filters allow searches by circulation or region.
How do tracking tools operate?
Tools dashboard 40 KPIs. Alerts notify on drops below 5% benchmarks. Read how research reports gain reach through media partners: How research reports gain reach through media partners.
What benefits arise from media alliances for research and reports?
Benefits deliver 5 million impressions per report, 40% engagement increase, 25% referral traffic growth, cost reductions of 50%, and enhanced credibility via high-authority placements. Impressions scale reach. Single reports hit 5 million across networks. National outlets contribute 60%. Engagement rises through native formats. Click rates average 3.2%, shares reach 1,500 per report. Referral traffic boosts source sites. Alliances drive 25% of monthly visits from media links.
Costs drop via bulk agreements. Per-report fees average £500 versus £2,000 direct pitches. Credibility builds from placements. Domain authorities transfer to research profiles. Data informs future work. Alliances provide audience insights from 1 million interactions yearly. Benefits compound over time. Multi-year alliances double annual output.
What use cases illustrate media alliances for research and reports?
Use cases feature economic forecasts distributed to 100 outlets reaching 3 million readers, health studies in 80 science sections with 2,000 citations, environmental analyses across 150 platforms generating policy mentions, and tech trend reports in 120 business channels driving 15% download increases.
Economic forecasts exemplify B2G applications. Organizations release quarterly GDP projections. Distributions place summaries in 100 outlets. Reach totals 3 million. Policymakers reference findings in 20% of briefings.
Health studies target public awareness. Reports on vaccination efficacy publish in 80 sections. Engagement yields 500,000 views and 2,000 academic citations within six months. Environmental analyses influence advocacy. Climate impact reports syndicate to 150 platforms. Outputs include 50 parliamentary mentions and 10,000 public petitions.
Tech trend reports serve industry. Annual innovation outlooks hit 120 channels. Results show 15% rise in report downloads from source sites.
These cases span sectors. Each logs 72-hour cycles from submission to peak reach.
What outcomes mark health studies?
Studies prompt 300 media follow-ups. Citation networks expand to 500 papers yearly. Discover promotion strategies for research reports: How Time Intelligence Media Group promotes research reports.