
In the evolving landscape of public relations, measuring impact of PR distribution has become essential for proving value and refining strategies. Businesses invest in PR distribution services to amplify reach, but without robust metrics, efforts remain guesswork. This guide dives into actionable ways to quantify success, from impressions to conversions.
By tracking the right KPIs, brands can optimize campaigns, justify budgets, and demonstrate ROI. Time Intelligence Media Group’s PR Distribution Services provide the foundation for such measurable outcomes.
Impressions and Reach: Quantifying Initial Exposure
Impressions represent the total potential views of your PR content across media outlets, forming the baseline for measuring impact of PR distribution. Reach extends this by counting unique audience members exposed, accounting for overlaps in multi-channel distribution.
For example, a SaaS company’s press release distributed to 500+ outlets might generate 2 million impressions via wires like Business Wire. Detailed analysis reveals geographic breakdowns—say, 40% U.S., 30% Europe—highlighting global efficacy. Tools like Google Analytics and media monitors track these, showing how initial exposure correlates with brand lift.
Without this metric, campaigns lack direction; high impressions with low engagement signal content mismatches. Brands refining based on reach data often see 20-30% subsequent improvements, per PR industry reports.
Share of Voice: Benchmarking Against Competitors
Share of voice (SOV) measures your brand’s media presence relative to competitors, a critical lens for assessing PR distribution impact. Calculated as (your mentions / total industry mentions) x 100, it reveals market dominance.
Consider a retail brand during Black Friday: Their PR push on holiday trends captured 25% SOV against rivals, tracked via tools like Brandwatch. This involved comparing mention volume, sentiment, and outlet prestige over 30 days. Detailed breakdowns show not just quantity but quality—Tier 1 outlets like CNN weigh heavier.
SOV guides adjustments; low shares prompt aggressive pitching. Case studies indicate brands boosting SOV by 15% via targeted distribution achieve 10% sales uplifts.
Earned Media Value and ROI Calculations
Earned media value (EMV) translates PR exposure into advertising equivalents, essential for measuring impact of PR distribution financially. EMV = (impressions x ad rate) adjusted for credibility multipliers (earned media often valued 2-3x higher).
A health tech firm’s campaign generated $500K EMV from Forbes features, far exceeding $100K costs for 5x ROI. Detailed formulas incorporate factors like audience demographics and engagement rates. For precision, compare against benchmarks: B2B PR averages $4.50 per $1 spent.
ROI extends to business outcomes—leads, sales—linking PR to revenue. Structured tracking via UTM parameters ensures attribution accuracy.
Engagement Metrics: Beyond Views to Interactions
Engagement metrics like clicks, shares, and comments gauge audience resonance in PR distribution efforts. High engagement signals content relevance, amplifying organic spread.
In a scenario, an eco-brand’s sustainability PR release saw 15% engagement rate (shares + comments / impressions), driven by social amplifications. Tools dissect this: 5K clicks to site, 2K shares on LinkedIn. Compare to industry averages (2-5%) to benchmark.
Lists of key engagement trackers:
- Social shares: Indicate virality potential.
- Time on page: Measures depth of interest.
- Bounce rate: Flags irrelevant traffic.
Optimizing here refines future distributions for deeper impact.
Media Monitoring Platforms and Their Features
Media monitoring tools centralize data for measuring impact of PR distribution, scanning global sources in real-time. Platforms like Cision or Meltwater offer dashboards for impressions, sentiment, and backlinks.
A fintech example: Monitoring post-distribution revealed 300 mentions, 85% positive, with 50 backlinks boosting SEO. Detailed sentiment analysis uses AI to score nuance, e.g., “innovative” vs. “risky.” Integration with CRM ties this to leads.
Free alternatives like Google Alerts suit startups, but paid tools provide competitive intel. Regular audits ensure comprehensive coverage.
Integrating PR Data with Marketing Analytics
Seamless integration merges PR metrics with Google Analytics or HubSpot for holistic views. Custom dashboards visualize PR’s role in funnel progression.
For instance, a travel agency’s PR on safe destinations correlated 12% traffic increase and 8% bookings via tagged links. Detailed attribution models credit PR for assisted conversions, often undervalued in last-click scenarios.
Best practices include:
- Use UTM tags on all PR-driven links.
- Set up event tracking for mentions.
- Run A/B tests on distribution channels.
This unification proves PR’s enterprise-wide value.
Tech Startup’s PR ROI Breakthrough
A cybersecurity startup measured PR distribution impact through a six-month campaign, starting with baseline SOV at 5%. Post-distribution of breach prevention stories, impressions hit 1.5M, EMV $300K, and leads surged 40%.
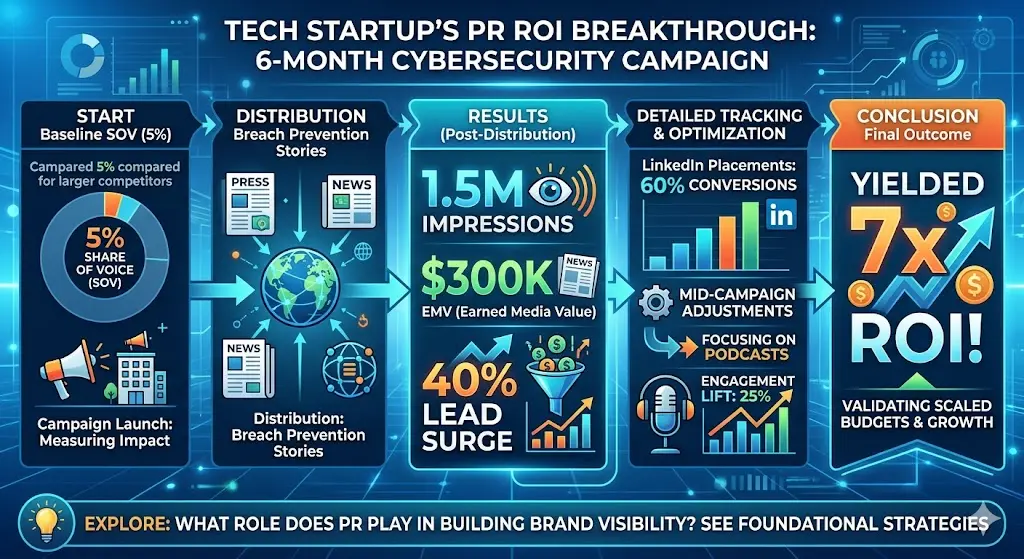
Detailed tracking showed LinkedIn placements drove 60% conversions. Adjustments mid-campaign—focusing on podcasts—lifted engagement 25%. To explore what role does PR play in building brand visibility, see foundational strategies. This yielded 7x ROI, validating scaled budgets.
Retail Brand’s Multi-Channel Success Metrics
A fashion retailer tracked holiday PR across TV, print, and digital, achieving 10M impressions and 22% SOV. Engagement via UGC campaigns added 50K interactions.
Analytics revealed TV spots converted best (15% to sales), informing 2026 allocations. For outcome-driven options, discover Why Brands Need Managed PR Distribution.
Key lessons: Diversify channels; iterate on data.
Attribution Difficulties and Multi-Touch Models
PR’s long-tail effects complicate measurement, with impacts spanning weeks. Multi-touch attribution assigns partial credit across channels.
Solution: Implement linear models weighting PR highly for awareness. A B2B example credited PR for 30% of a 90-day sales cycle.
Data Overload and Prioritization Strategies
Volume overwhelms; prioritize vanity (impressions) vs. actionable (conversions) metrics.
Filter via goals: Use dashboards for 5-7 KPIs. Brands streamlining report 2x faster insights.
Precision in PR Distribution Measurement
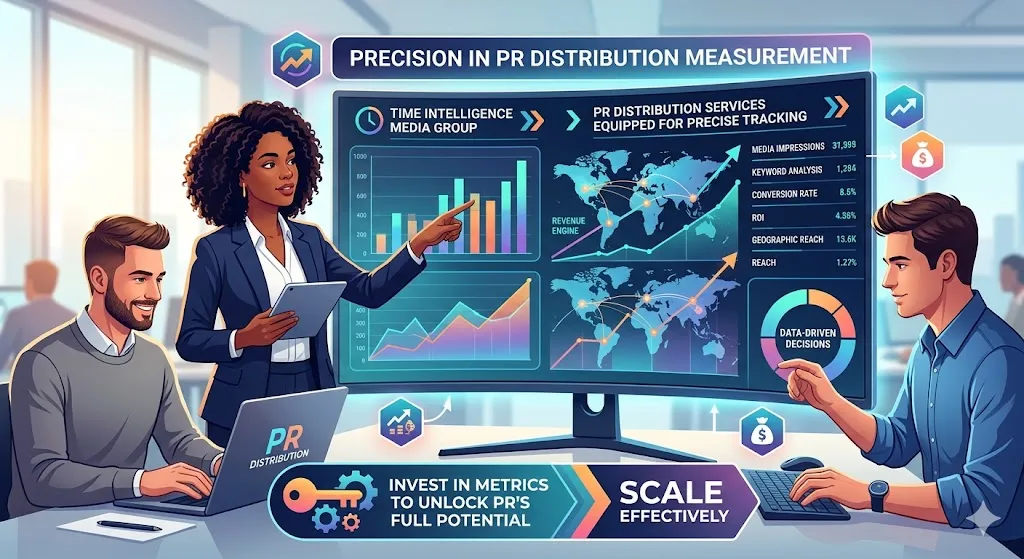
Measuring impact of PR distribution empowers data-driven decisions, turning PR into a revenue engine. Time Intelligence Media Group offers PR Distribution Services equipped for precise tracking, helping brands scale effectively. Invest in metrics to unlock PR’s full potential.