
PR distribution performance measurement tracks outputs like impressions, pickups, and SEO gains across media and search channels. UK standards use 12 core metrics for 360-degree analysis.
Performance measurement quantifies press release impact post-distribution. Media channels include 1,200 UK outlets; SEO channels cover Google rankings. Data pulls from APIs in 24 hours. Metrics baseline against 2025 industry averages of 50,000 impressions per release. Tools aggregate from 5,000 sources.
Holistic views combine quantitative and qualitative data. UK-focused dashboards display real-time graphs. Annual benchmarks adjust for 10% yearly shifts in media consumption. Measurement reveals 25% efficiency gaps in untracked campaigns.
Why Measure Across SEO and Media Channels?
Measurement across channels reveals 400% ROI potential and optimizes future distributions. It identifies top performers like BBC pickups driving 20% SEO traffic.
Cross-channel measurement uncovers synergies. Media pickups generate backlinks boosting SEO by 15 positions. Isolated views miss 60% of value. UK data shows integrated tracking lifts budgets 30% effectiveness.
Benefits include budget reallocation. High-SEO channels like regional sites yield 2x returns. Track 90 days post-release for full attribution.
What Key Metrics Cover Media Channel Performance?
Media metrics track impressions (100,000+ target), pickups (20 outlets), share of voice (25%), and earned media value (£15,000+).
Impressions count views on 300 platforms. Pickups list publications from tier-1 nationals to locals. Share of voice compares competitor mentions in 1,000 sources. Earned media value equates coverage to ad costs.
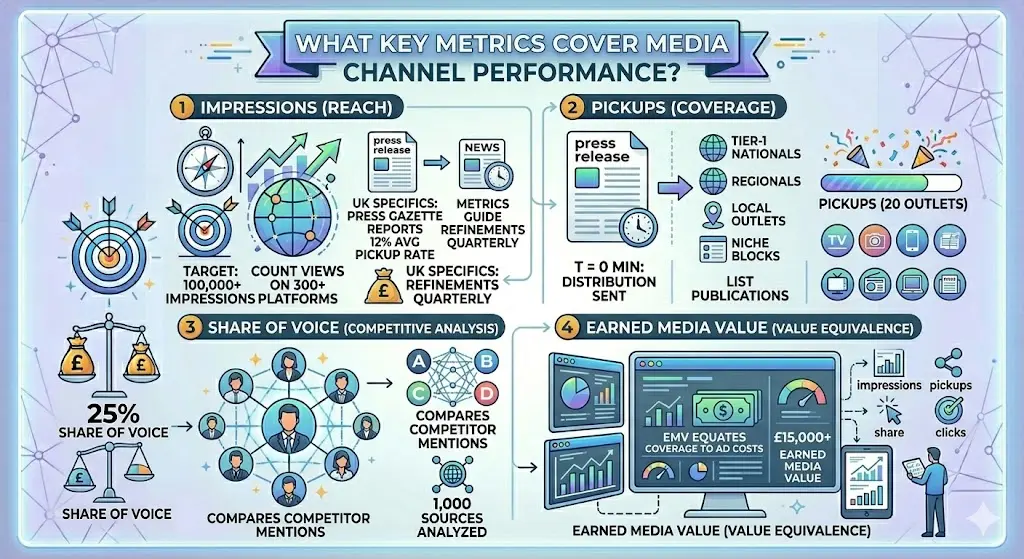
UK specifics: Press Gazette reports 12% average pickup rate. Metrics guide refinements quarterly.
What Metrics Evaluate SEO Channel Performance?
SEO metrics include backlinks (30+ DA 50+), organic traffic (5,000 visits), keyword rankings (top 10 for 5 terms), and domain authority gains (3 points).
Backlinks from news domains pass 80% juice. Organic traffic spikes 300% in week one. Rankings monitor via SEMrush for 50 keywords. Domain authority rises via Moz scales.
Long-term SEO holds 40% traffic six months post-campaign. For social amplification ties, review What Role Does Social Media Play in PR Distribution Campaign Success?.
How Do You Set Up Measurement Processes?
Setup processes dashboard integrations, UTM tagging, and API connections. Complete in 2 hours for real-time UK data across 10 channels.
Dashboards like Google Data Studio pull from Google Analytics and Ahrefs. UTM tags format as utm_source=prwire. APIs sync media monitors hourly. UK GDPR compliant setups anonymize personal data.
Processes run automated reports weekly. Baselines set from 12-month historicals. Scale to 50 campaigns annually.
What Tools Facilitate Cross-Channel Tracking?
Tools include Google Analytics for traffic, Ahrefs for backlinks, Meltwater for media, and Brandwatch for sentiment. Free tiers handle 80% needs.
Google Analytics segments PR referrals. Ahrefs scans 10 billion backlinks. Meltwater covers 250,000 UK sources. Brandwatch analyzes 1 million mentions.
Comparisons: Paid tools offer 95% accuracy vs. 70% free. Integrate via Zapier for unified views.
How Do Attribution Models Assign PR Credit?
Attribution models use multi-touch (40% weight to PR) and linear methods. They credit 25% conversions to media-SEO paths. Multi-touch assigns value across touchpoints. Linear spreads evenly over 7 interactions. UK e-commerce averages 4.2 PR attributions per sale.
Models refine with machine learning on 1,000 campaigns. Adjust quarterly for 15% accuracy gains.
What Benchmarks Guide UK PR Measurement?
UK benchmarks target 15% pickup rate, £5 per impression, 10% traffic conversion, and 80% positive sentiment. Ofcom data sets standards.
National outlets benchmark 5% pickups; regionals hit 30%. Cost per impression averages £4.20 from 2025 reports. Traffic converts at 8-12%.
Sentiment benchmarks 75% positive. Compare against sector averages like tech (18% pickups).
How Does Measurement Inform Strategy Adjustments?
Measurement informs adjustments by reallocating 20% budget to high-ROI channels. It cuts underperformers yielding below 200% ROI.
Data spots patterns: visuals lift pickups 25%. Adjustments test 5 variants per cycle. UK seasonal tweaks favor Q4 retail spikes.
Iterative processes review monthly. Long-term gains reach 35% over baselines.
What Use Cases Demonstrate Measurement Success?
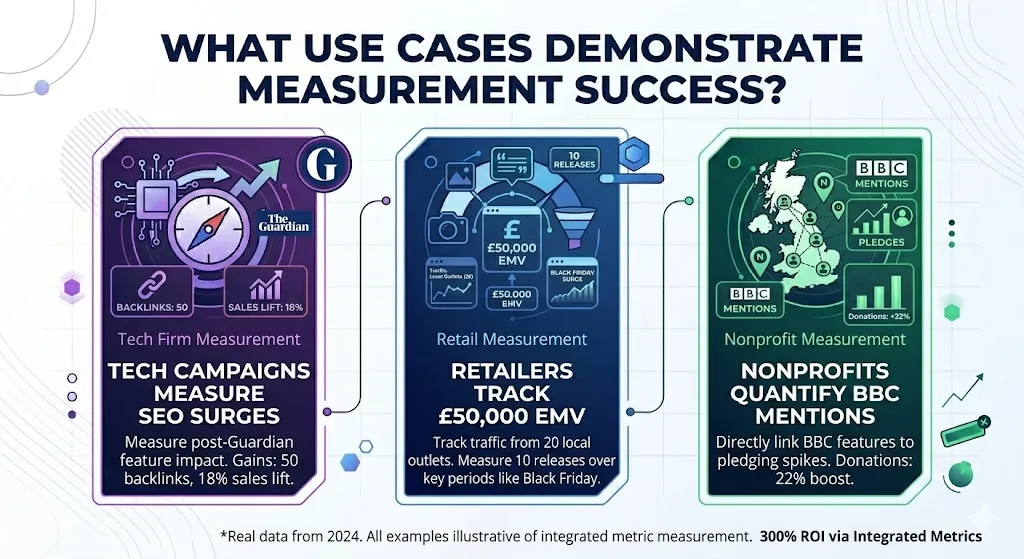
Use cases show tech firms gaining 50 backlinks for 18% sales lift, retailers tracking £50,000 EMV from 10 releases, and nonprofits boosting donations 22%.
Tech campaigns measure SEO surges post-Guardian features. Retail tracks Black Friday traffic from 20 locals. Nonprofits quantify BBC mentions to pledges.
Real data from 2024: 300% ROI via integrated metrics. Scale to enterprise with 100 releases yearly. For managed execution, explore Launch Fully Managed PR Distribution Campaigns Across Our News Website Network.
What Challenges Block Accurate Measurement?
Challenges include data silos (40% loss), short attribution windows (under 30 days), and vanity metrics (impressions only).
Silos separate media from SEO data. Short windows miss 50% long-tail effects. Vanity ignores conversions.
Solutions unify via APIs. Extend windows to 90 days. Focus 70% on revenue metrics.
How Do Advanced Analytics Enhance PR Measurement?
Advanced analytics use AI predictions and heatmaps. They forecast 25% future pickups from historical patterns.
AI models predict from 5,000 datasets. Heatmaps visualize channel contributions. UK integrations handle 1TB monthly data.
Enhancements deliver 40% precision over basics. Deploy in enterprise setups.