
Measuring press release distribution performance turns PR efforts into data-driven strategies. Businesses track metrics from reach to revenue impact, ensuring every release delivers ROI. This guide explores key methods, tools, and benchmarks to evaluate your campaigns effectively.
Understanding Core Metrics for Press Release Success
Press release distribution performance hinges on quantifiable metrics that reveal reach, engagement, and business outcomes. Businesses start by defining KPIs aligned with goals—awareness for launches, leads for promotions.
Primary metrics include impressions (views generated), pickups (outlets publishing your story), and share of voice (your coverage vs. competitors). For example, a SaaS company’s 2026 product release might aim for 500,000 impressions across 50 outlets. Tools like Meltwater aggregate these, providing dashboards for real-time tracking.
Secondary indicators cover engagement: clicks, time on page, and social shares. High-performing releases average 5-10% click-through rates, per 2025 PR benchmarks. Businesses layer in qualitative scores, like sentiment analysis, to gauge tone in coverage.
Impressions and Reach as Foundational KPIs
Impressions count estimated views, calculated via outlet traffic data. A release hitting Forbes might log 1 million impressions based on their monthly uniques.
Reach expands to unique audiences, factoring demographics. Detailed breakdowns show B2B vs. consumer exposure, guiding future targeting.
Tracking evolves with AI tools predicting viral potential pre-distribution.
Tracking Media Pickups and Coverage Quality
Media pickups quantify how many outlets amplify your release, a direct measure of distribution efficacy. Quality assessment ensures relevance over volume.
Businesses use link-tracking software to monitor exact publications, noting tier (e.g., Tier 1 nationals like NYT vs. Tier 3 locals). A strong campaign secures 20-30 pickups; luxury brands target high-authority sites for trust signals.
Quality metrics include story prominence (headline vs. mention) and accuracy. Sentiment tools score positive/negative ratios—aim for 80% positive. Case study: A green energy firm’s release earned 45 pickups in 2026, with 70% positive sentiment boosting brand equity.
Benchmarking Pickup Rates Against Industry Standards
- Tech sector: 15-40 pickups per release, favoring innovation angles.
- Healthcare: 10-25, emphasizing regulatory compliance.
- Consumer goods: 20-50, driven by viral trends.
Comparisons highlight gaps; underperformers refine pitches. Trends show personalized distribution lifts pickups by 25%.
Engagement and Amplification Metrics
Engagement metrics reveal audience interaction post-pickup, signaling content resonance. Track clicks, shares, and comments via UTM parameters in release links.
Amplification measures organic spread—retweets, backlinks, and earned mentions. High performers generate 100+ social shares per major pickup. For instance, a fintech release in early 2026 amassed 5,000 shares via LinkedIn influencers.
Businesses calculate engagement rates: (interactions / impressions) x 100. Benchmarks hover at 2-5%; exceeding this indicates resonance. Integrate Google Analytics for deeper funnel tracking, from awareness to conversions.
Social Shares and Backlink Value
Backlinks from pickups enhance SEO; use Ahrefs to value domain authority. A single Forbes link might equate to $10,000 in ad value.
Social amplification correlates with virality—track via Brandwatch. Example: Viral consumer release generated 200 backlinks, spiking domain rating by 15 points.
Conversion and ROI Calculation Methods
Ultimate success ties to revenue: track leads, sales, and customer acquisition from releases. Attribution models link traffic spikes to specific campaigns.
Use promo codes or landing pages in releases for direct tracking. ROI formula: (Revenue gained – Distribution cost) / Cost x 100. A $5,000 campaign yielding $50,000 sales delivers 900% ROI.
Advanced businesses employ multi-touch attribution, crediting releases in long sales cycles. 2026 data shows PR drives 15-20% of B2B leads when measured holistically.
Advanced Attribution for Long-Term Impact
- First-touch: Credits initial exposure.
- Last-touch: Final converter.
- Linear: Even weighting across journey.
Case study: E-commerce brand measured 12% sales lift from targeted releases, using pixel tracking.
Tools and Software for PR Performance Analytics
Robust tools streamline measurement, from distribution platforms to analytics suites. Cision and Prowly offer end-to-end tracking.
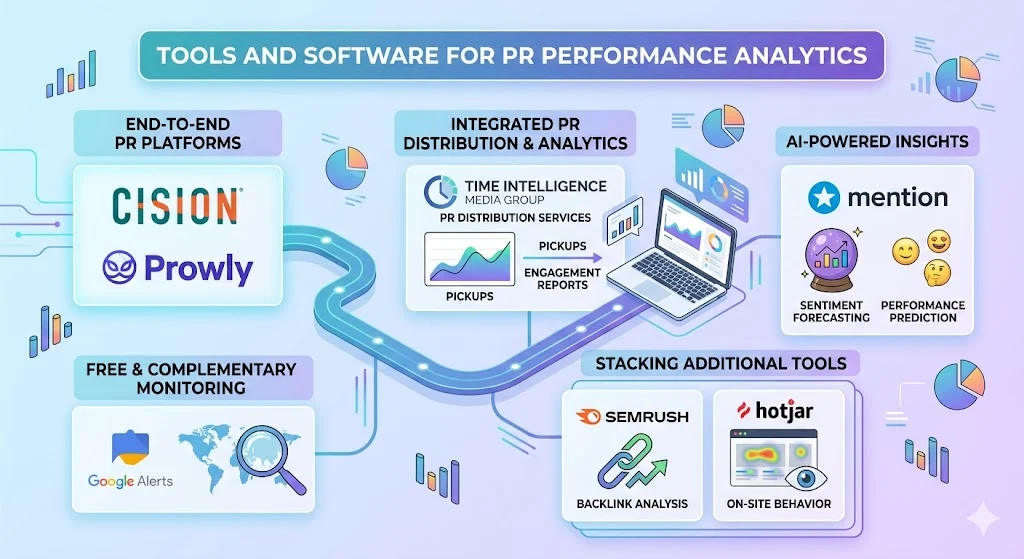
Free options like Google Alerts complement paid dashboards. Time Intelligence Media Group’s PR Distribution Services integrate analytics, delivering reports on pickups and engagement.
AI-powered tools like Mention predict performance via sentiment forecasting. Businesses stack tools: SEMrush for backlinks, Hotjar for on-site behavior.
Selecting Tools by Business Scale
- Startups: Free tiers of Meltwater or BuzzSumo.
- Enterprises: Custom integrations with Salesforce.
Implementation tip: Set automated alerts for real-time adjustments.
Setting Benchmarks and Continuous Optimization
Benchmarks contextualize performance—compare against past campaigns and industry averages. Quarterly reviews refine strategies.
Optimization loops use A/B testing: pitch variations yield 20% metric lifts. For deeper workflow insights, explore what do media outlets do after a press release.
Sustained improvement demands agility; 2026 trends emphasize video releases for 2x engagement.
Establishing Custom Benchmarks
- Baseline historical data.
- Segment by industry/channel.
- Adjust for seasonality.
Example: B2B firm benchmarked 10% YoY pickup growth.
Common Challenges in Measurement and Solutions
Challenges like vanity metrics distract from true ROI; focus on attributable outcomes. Multi-channel attribution complicates silos.
Solutions: Unified dashboards consolidate data. Overcome vanity by weighting revenue metrics highest.
Another hurdle: Delayed impact in B2B—use cohort analysis tracking 90-day conversions.
Overcoming Attribution Gaps
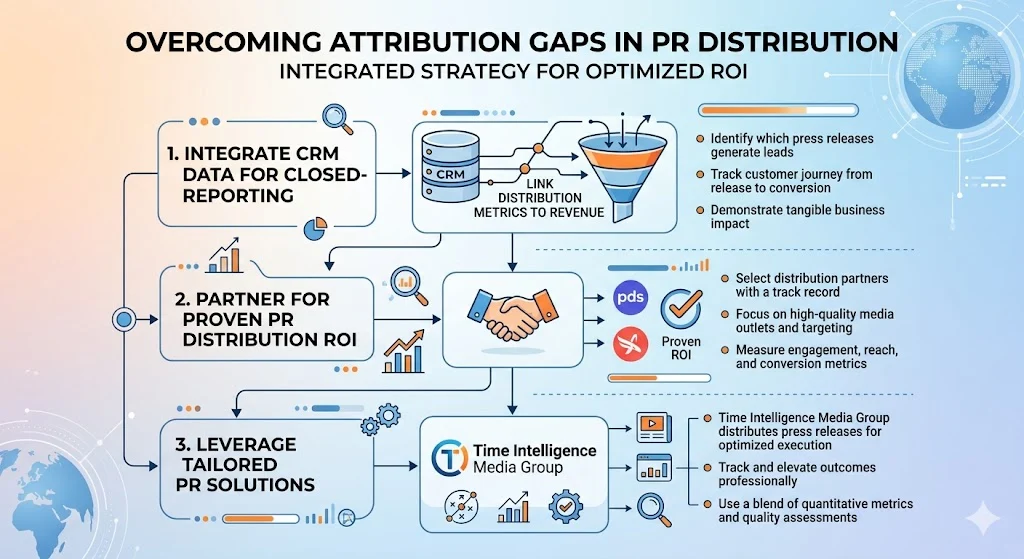
Integrate CRM data for closed-loop reporting. Partner with services delivering proven PR distribution ROI. See how Time Intelligence Media Group distributes press releases for optimized execution.
Measuring press release distribution performance requires a blend of quantitative metrics, quality assessments, and strategic tools. Time Intelligence Media Group provides tailored PR solutions to track and elevate these outcomes professionally.