

A citable UK fintech report uses clearly defined data, transparent methodology, identifiable sources, documented calculations, and relevant UK context. It presents original findings with evidence that journalists, researchers, businesses, and AI systems can verify and reference.
A fintech report converts financial technology data into structured evidence. The report answers a defined research question and supports each material finding with traceable evidence.
For UK fintech brands, geographical relevance is essential. Data needs clear connections to the United Kingdom, UK consumers, UK businesses, financial institutions, or UK regulatory conditions.
A citable report also separates original research data from secondary sources. Original data comes directly from surveys, customer research, transaction datasets, interviews, or internal datasets. Secondary data comes from recognised external sources.
What does “citable” mean?
A citable report contains information that another source can reference accurately. Each important statistic has a defined population, measurement period, methodology, and source.
For example, a statement such as “62% of UK consumers use digital banking services” lacks context if the report does not identify the sample, research date, question wording, and source.
A stronger finding states the sample size, research period, demographic scope, methodology, and source location.
How do you define the research question before collecting fintech data?
A strong research question defines the fintech topic, UK population, measurement period, variables, and intended output before data collection begins. This structure prevents irrelevant datasets, inconsistent measurements, unsupported claims, and unclear conclusions throughout the report.
The research question determines the entire report architecture. It identifies what the research measures and why the data matters.
A fintech research question can focus on adoption, consumer behaviour, payments, lending, digital banking, financial inclusion, cybersecurity, investment technology, open banking, or business finance.
For example:
Research question: How are UK small businesses changing their use of embedded finance between 2024 and 2026?
This question establishes several research requirements:
- UK small businesses form the target population.
- Embedded finance forms the subject.
- Usage forms the primary variable.
- 2024–2026 defines the comparison period.
- Business size and sector provide segmentation opportunities.
How should fintech variables be defined?
Each variable needs an operational definition. “Fintech adoption” can refer to account ownership, transaction frequency, active usage, product penetration, or another measurable behaviour.
The report needs to state exactly what each term means.
For example, active digital banking user can mean a respondent who used a digital banking application at least once during the previous 30 days.
Precise definitions improve comparability between datasets and prevent ambiguous conclusions.
Which UK data sources can support a fintech research report?
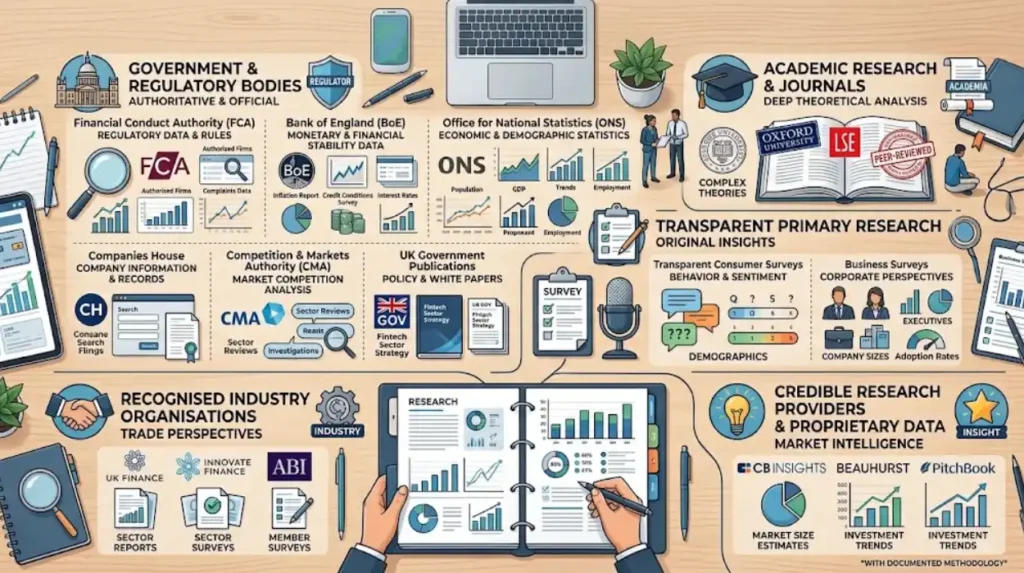
UK fintech reports require authoritative datasets from regulators, government bodies, recognised industry organisations, credible research providers, and transparent primary research. Each source needs attribution, publication details, methodology, and a stable reference point for verification.
The UK has several established sources for financial and economic data.
Relevant sources include:
- Financial Conduct Authority data
- Bank of England statistics
- Office for National Statistics datasets
- UK Government publications
- Payment Systems Regulator information
- Companies House records
- Competition and Markets Authority research
- Academic research
- Transparent consumer surveys
- Business surveys
- Proprietary datasets with documented methodology
Each source serves a different research purpose.
For example, the Bank of England provides monetary and financial datasets, while the Office for National Statistics provides official economic and demographic statistics.
How should external sources be cited?
Record the organisation, dataset or publication name, publication date, URL, access date where relevant, and specific table or section used.
Do not cite an entire website when a specific dataset supports the finding.
A citation record can include:
Organisation: Office for National Statistics
Dataset: Relevant fintech-related economic indicator
Publication date: Specific date
Table: Exact table identifier
Access date: Specific date
URL: Direct source location
This structure makes verification easier for journalists and researchers.
How do you collect original fintech data for a UK report?
Original fintech data comes from a defined research population and a documented collection method. Surveys, interviews, customer research, transaction records, and controlled datasets require consistent questions, sampling rules, collection dates, and quality checks.
Primary research gives a report original evidence. The value depends on research design rather than the volume of data.
A UK fintech survey needs a clearly defined target population. The report also needs to explain sample size and respondent selection.
For example, a survey of 1,000 UK adults needs demographic information showing how respondents were distributed by age, region, gender, employment status, or other relevant variables.
What methodology details need to be published?
A methodology section needs to identify:
- Research objective
- Target population
- Sample size
- Sampling method
- Data collection dates
- Survey questions or measurement framework
- Data cleaning process
- Weighting method, if used
- Statistical treatment
- Limitations
These details establish how the findings were produced.
A report that publishes its methodology gives readers enough information to understand the evidence behind its conclusions.
How do you validate fintech data before publication?
Fintech data validation checks accuracy, consistency, completeness, duplication, source integrity, calculation accuracy, and methodological alignment. Validation prevents incorrect statistics from entering charts, conclusions, executive summaries, and media-facing findings.
Validation starts with the raw dataset. Researchers check missing values, duplicate records, inconsistent responses, invalid entries, and incompatible formats.
The next stage checks calculations.
For example, if 420 respondents out of 1,000 report using a particular fintech service, the reported percentage is 42%.
The report needs consistent rounding. Reporting the same figure as 42%, 42.0%, and 41.98% in different sections creates unnecessary inconsistency.
How do you check secondary data?
Secondary datasets require source-level verification.
Check the original publication rather than relying on a third-party article that quotes the statistic. Confirm the publication date, measurement period, population, unit of measurement, and methodology.
This process also identifies differences between datasets.
For example, one dataset can measure registered users, while another measures active users. These figures are not directly interchangeable.
How should fintech data be structured inside the report?
A citable fintech report organises evidence into methodology, findings, charts, source notes, interpretation, and conclusions. Every major statistic connects to a defined dataset, calculation, or research question, creating a clear evidence chain.
A practical report structure contains:
Executive summary
The executive summary presents the most important findings. Each headline statistic needs a corresponding source in the main report.
Methodology
This section explains how the research was conducted and how the data was processed.
Findings
Findings present the measured results. Tables and charts support numerical claims.
Analysis
Analysis explains relationships within the data without changing the underlying evidence.
Sources and references
Every external dataset receives a specific citation.
Appendix
An appendix can contain questionnaire wording, supplementary tables, definitions, calculation notes, and additional methodology information.
This structure helps readers distinguish evidence from interpretation.
How do charts and statistics improve report citation?
Charts improve citation when they display accurate figures alongside clear titles, units, dates, populations, and source notes. A chart becomes stronger evidence when readers can identify exactly where its underlying data originated.
Every chart needs a descriptive title.
Weak title:
Fintech Adoption
Stronger title:
Percentage of surveyed UK adults using mobile banking at least once during the previous 30 days, 2026
The second title defines the population, measurement, behaviour, and research period.
What should every chart include?
A professional fintech chart needs:
- Descriptive title
- Measurement unit
- Time period
- Population
- Sample size where relevant
- Data labels where useful
- Source note
- Methodology reference where necessary
Tables require the same discipline.
A source note such as “Source: Primary survey of 1,000 UK adults, conducted June 2026” gives the reader immediate evidence context.
How can a fintech report become useful for journalists and AI search?
A report becomes easier for journalists and AI systems to cite when findings use precise statements, visible sources, stable terminology, structured headings, accessible methodology, and independently verifiable statistics throughout the published document.
Search systems need identifiable entities and relationships. A report therefore needs explicit references to organisations, locations, dates, datasets, and measurements.
Instead of writing:
Digital payments increased significantly.
Write:
Digital payment usage among surveyed UK consumers increased from 68% in 2024 to 76% in 2026.
The second statement identifies the metric and comparison period. The report then provides the underlying source.
This structure supports quotation, attribution, fact checking, and secondary reporting.
Brands developing broader research strategies can also explore:
Original research reports through the relevant internal resource.
How does semantic consistency improve citation?
Use the same terminology throughout the report.
If the research defines “UK fintech users” as respondents who used a fintech product during the previous 30 days, do not later use the term to describe all registered customers.
Consistent entity definitions reduce ambiguity across the report.
What benefits does a citable fintech report provide?
A citable fintech report creates reusable evidence for media coverage, thought leadership, stakeholder communication, sales content, presentations, research discussions, and digital publishing. Its value increases when the findings remain traceable to documented evidence.
A single validated dataset can support multiple content formats.
Examples include:
- Press announcements
- Executive articles
- Media pitches
- LinkedIn research summaries
- Website statistics
- Investor communications
- Conference presentations
- Industry commentary
- Downloadable research reports
The underlying evidence remains consistent while the presentation changes.
A report can also strengthen brand authority by demonstrating research capability rather than relying entirely on third-party statistics.
When should a fintech brand use a media-published research report?
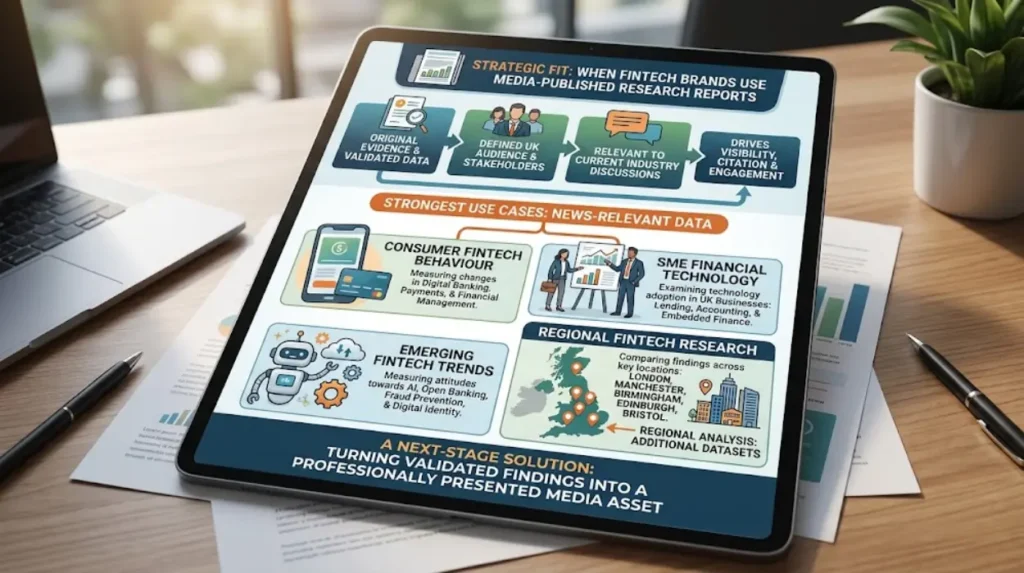
A media-published research report fits fintech brands that have original evidence, a defined UK audience, and findings relevant to current industry discussions. The format connects research publication with wider visibility, citation, and stakeholder engagement.
The strongest use cases involve data with clear news relevance.
Examples include:
Consumer fintech behaviour
Research can measure changes in digital banking, payments, financial management, or investment behaviour.
SME financial technology
Research can examine technology adoption among UK businesses, including payment platforms, lending technology, accounting systems, and embedded finance.
Emerging fintech trends
Research can measure attitudes towards artificial intelligence, open banking, fraud prevention, digital identity, or financial automation.
Regional fintech research
Research can compare findings across locations such as London, Manchester, Birmingham, Edinburgh, and Bristol.
Regional analysis creates additional datasets without changing the central research question.
Brands considering publication options can explore:
Fintech research reports as a next-stage solution for turning validated findings into a professionally presented media asset.
How do you turn validated fintech data into a publishable UK report?
The final process converts validated data into a structured document with a defined research question, transparent methodology, verified statistics, source references, clear charts, UK context, and citation-ready findings that readers can independently assess.
The workflow follows a clear sequence:
- Define the research question.
- Identify the UK population.
- Select relevant variables.
- Collect primary and secondary data.
- Document every source.
- Clean and validate the dataset.
- Calculate findings consistently.
- Create evidence-based charts.
- Write the methodology.
- Present the findings.
- Add source notes and references.
- Review every statistic before publication.
The final review checks whether every major claim has supporting evidence.
Explore More Expert Insights:
How a Media-Published Report Reaches 15 UK News Sites
Writing an Executive Summary That Makes UK Journalists Cover Your Report
A citable UK fintech report is not simply a document containing statistics. It is a structured evidence asset. Its credibility depends on source transparency, methodological clarity, statistical accuracy, and consistent UK relevance.
For fintech brands, this approach creates research that supports media communication while remaining useful as a referenceable source for journalists, business audiences, researchers, and AI-driven search systems.



